

- Published on
How to create a heat map of Covid-19 cases by zip code
- Authors
- Name
- Garrett Hughes
- @garretthughes


San Diego Heatmap
After posting the heat map of San Diego Covid-19 cases online I realized a lot of you had questions, so I figured I’d write a quick how-to on creating this heat map.
Step 1:
Find the data. San Diego county gives out a daily summary via zip code in PDF form, others may do this as well. Without this it won’t be possible to do a heat map of cases by zip code.
Step 2:
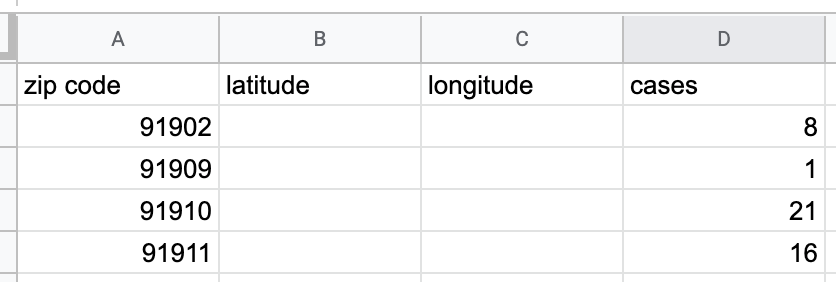
Now we need to translate these values into a spreadsheet. My suggestion is these 4 columns:
Zip, Latitude, Longitude, Cases
You’ll want to copy the zip code into the first column and copy the number of coronavirus cases into the fourth column.
Step 3:
At this point your spreadsheet should look like this:
We need to translate zip code to lat/lng values. You can either do this manually (by google-ing the {zip} lat long. This will give you the data in N/S/E/W you’ll want to translate that to pluses and minuses. I shared a few examples below:
33.1924°N, 117.3675°W -------BECOMES------ 33.1924, -117.3675 33.1924°S, 117.3675°E -------BECOMES------ -33.1924, 117.3675
Alternatively, if you have a lot of zip codes (or are lazy like me, remember this is one of the good traits of a programmer, you can do this programmatically using a little Vlookup magic, which I’ll share below.
Step 4: Optional
There are tons of free public assets online to accomplish this. The one I used can be found here. You’ll want to download that CSV and open it up in Google Sheets/Excel. First we’ll create a new sheet at the bottom

Next in the us-zip-code-latitude-and-longitude sheet you’ll need to make sure that Zip is in the first column (this is a limitation of Vlookup).

What your column headers should look like
Now it’s time for the formula, this is what I used for latitude:
=VLOOKUP(A2,'us-zip-code-latitude-and-longitude'!1:43192,4,FALSE)
and for longitude
=VLOOKUP(A2,'us-zip-code-latitude-and-longitude'!1:43192,5,FALSE)
For those unfamiliar with Vlookup (this is in Google Sheets) the formula reads:
=VLOOKUP(SEARCH_TERM, RANGE_OF_SHEET_YOUR_SEARCHING, WHAT_INDEX_YOUR DESIRED_VALUE_IS_IN, IF_THE_DATA_IS_SORTED_OR_NOT)
Quick heat check:
Your data should look like this now.

Step 5:
Now it’s time to input into Kepler.gl. Click https://kepler.gl/demo and it prompts you to upload data. To get your CSV, download the sheet with cases, zip and lat/long as a csv.

Step 6:
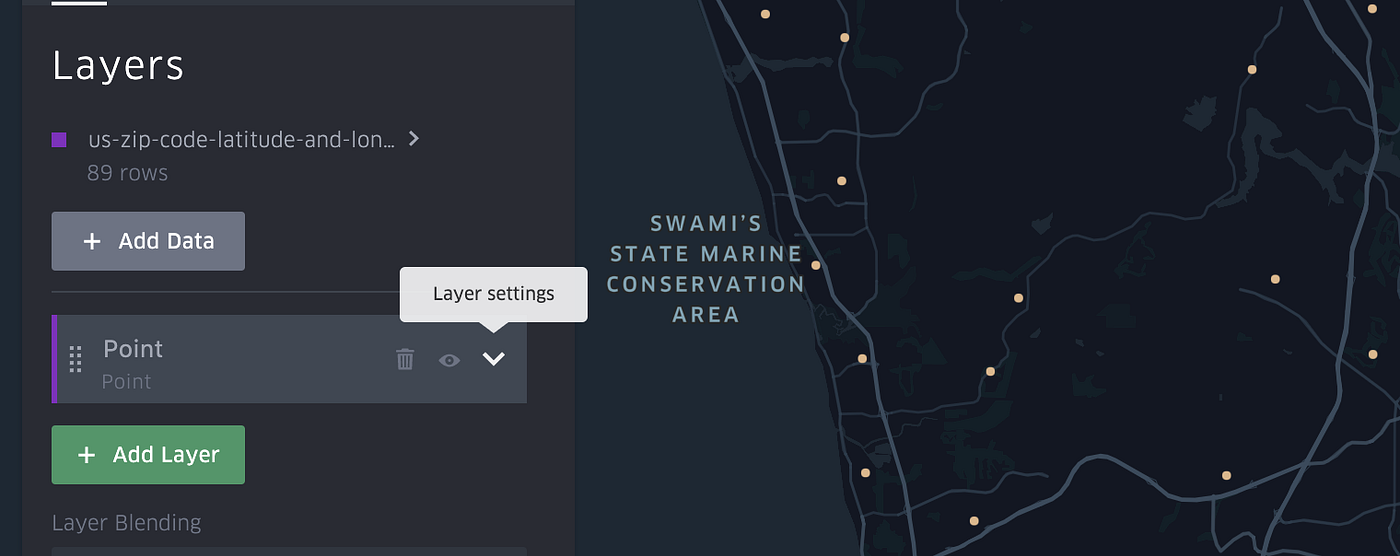
Drag that csv into the box on the Kepler page. You should see a bunch of small little dots.
Step 7:
Click the layer settings drop down
Step 8:
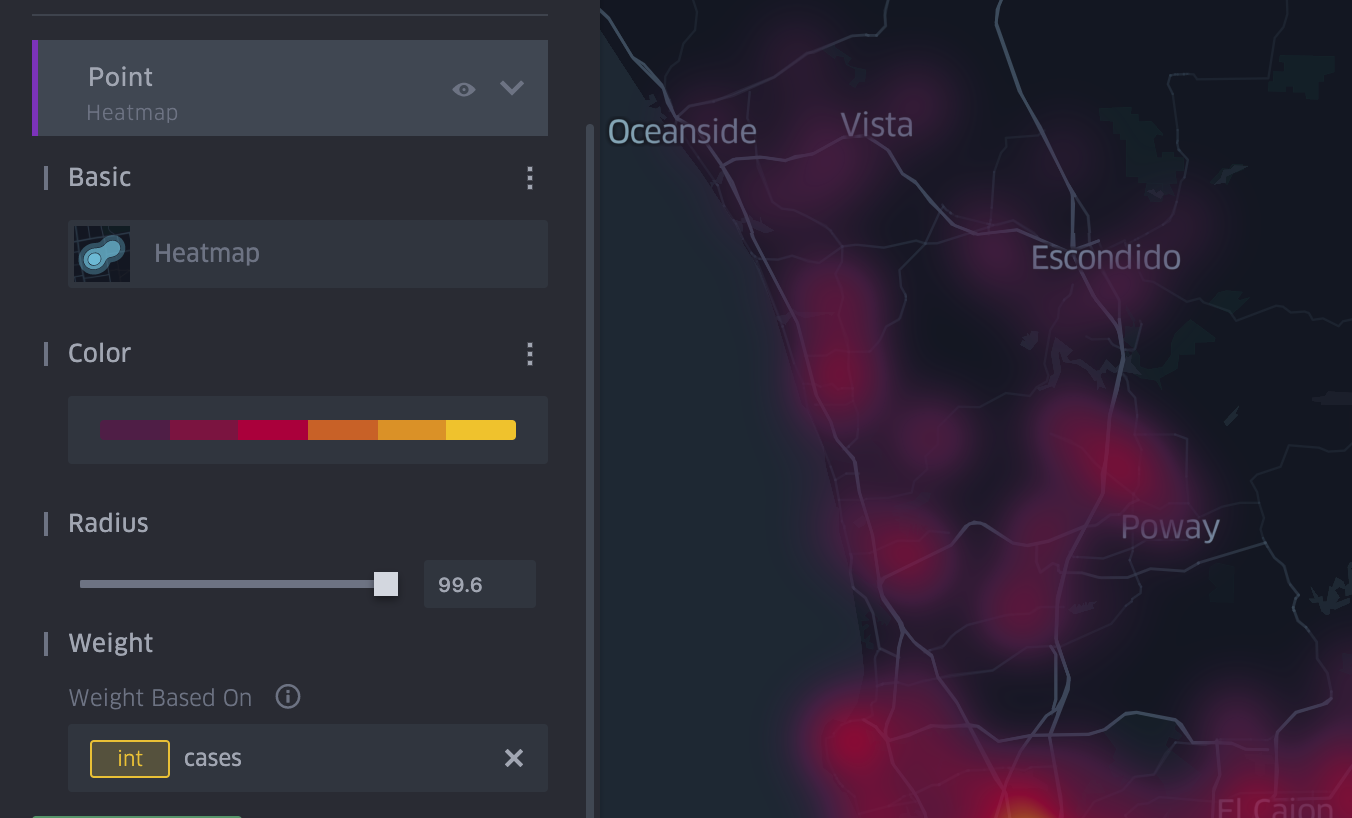
Update the settings to be a heat map (instead of point), put the radius to 100 (instead of 10) and change the weight from density to cases.
Step 9: Optional
If you would like others to see this you’ll want to click the export button in the top right:
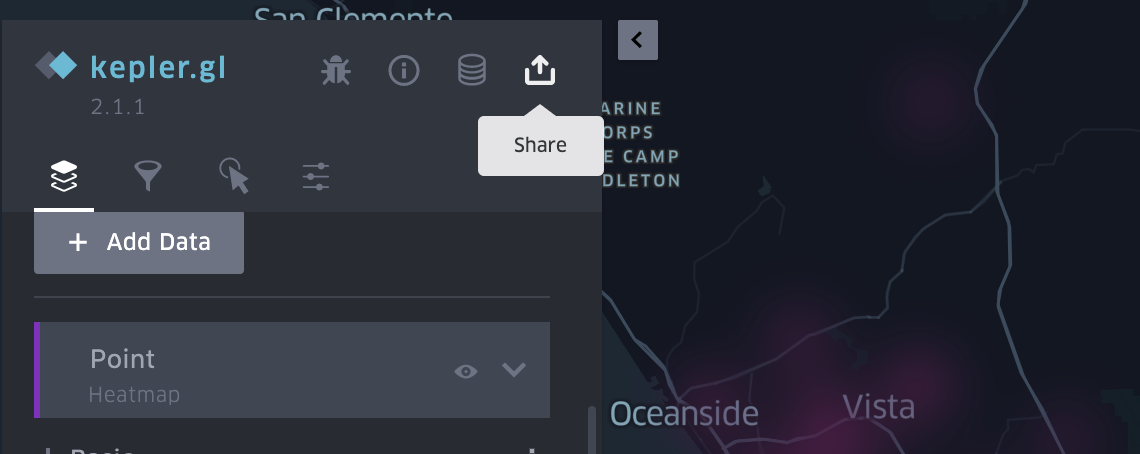
and click share map URL
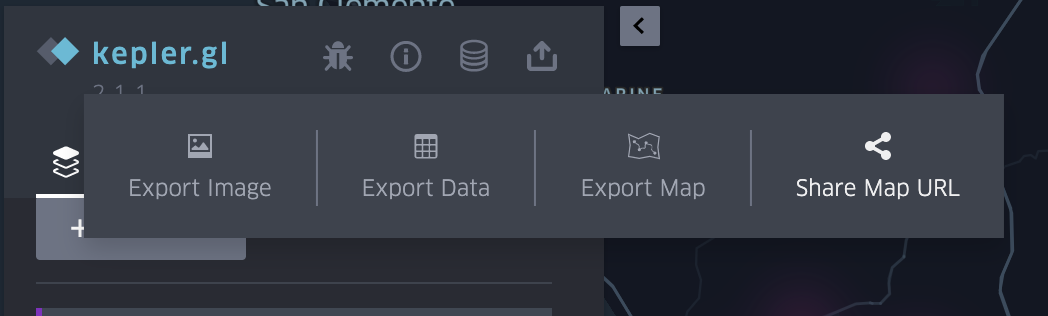
and lastly connect your Dropbox

and that’s it!
Once you connect you should be given a URL that is up to date. This data is not programmatic so you’ll need to update the CSV and re-upload into Kepler.GL daily (if you want to). Hope this is helpful for others! Feel free to ask questions if you get stuck.